Well then, to interpret that information you need to understand a few financial market concepts.
To be able to interpret the market information and predict tendencies you need to know a few financial concepts, such as:
- Weight of Money
- Volume
- Tendency lines
- Market Volatility
- Spoofing
- Breakouts
- Support and resistance
By grasping these concepts, it will become easier to interpret markets. That which was previously hard then becomes easy.
In this article I'll try to explain these concepts.
Credits:
Parts of this article are taken from the BetAngel Betting Exchange Academy Course, by Peter Webb.
What is Weight of Money (WOM)?
The Weight of Money indicator is an expression of how money is coming into the market or available at any given point and how it may force the market to move. It's an important concept to grasp how the structure of any given bet market is formed.
In betting markets, the users make the prices, not Betfair, neither does Betfair intervene in any way. Therefore, the price depends on how much people are willing to bet in favour or against, that is, the general law of supply and demand.
There are two ways of looking into the WOM indicator, through money that has been matched or through money that is available to be matched. It's useful to understand where the market believes there is more value. It's possible to understand, in a given market selection, if the price hasn't reached a maximum or minimum value, which gives out important indications on market support and resistance.
Most people use the unmatched money to predict how the market tends to move.
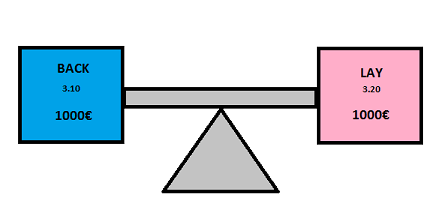
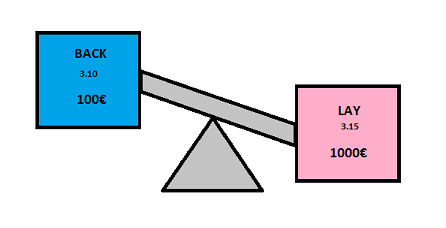
A good way of understanding WOM is to imagine it as two pans of a weighing balance, with the unmatched Back and Lack money on each side.
If the market is balanced, money should come in and be matched at the same rate on each side and the price will maintain:
In this next example, though, you can see that there is more money on the Back side, @3.10, so the market is likely to rise to 3.20 and the Back bets will be made @3.20:
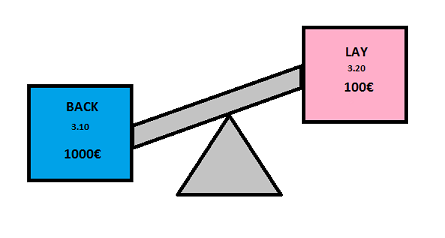
On the contrary, in this other example there is more money on the Lay side, so the odd is likely to drop. The new Lay price will be 3.10:
To better understand how WOM works watch the Sports Betting and Trading Course video, level 4:
Pre-live Trading: weight of money
It's important to understand that WOM is not an indicator you should use to know when to enter the market. To identify there is more money on one side is not enough. What you should look for, in fact, is a clear tendency that reinforces your market position.
These days, it's not possible to be a good trader without being able to interpret market graphics, since they are a good way of having a clear perspective of a market. By using graphics, it's not only possible to understand what hapened and why, but it also allows you to predict what is likely to hapen.
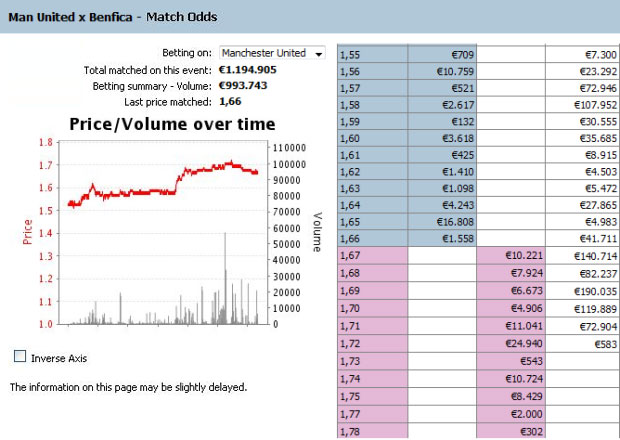
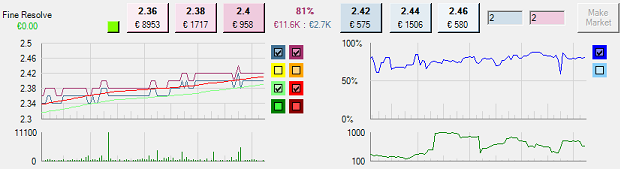
Price Graphic
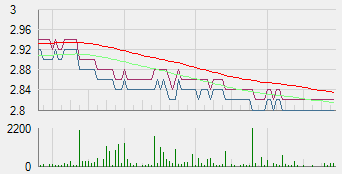
All betting software applications have graphics such as this, which represent the price variation and it's volatility.
The two lines, red and green, show how volatile the market can be. Interpreting these lines can help us understand the level of risk.
A very volatile market will have a bigger gap between these lines.
A stable market, on the contrary, will have a small gap between them.
Bellow this graphic there is a market volume graphic. This graphic helps you identify how the volume of money being traded may affect the market. The bars represent the amount of money being matched in each time interval and the maximum amount is given on the left hand side of the Graphic.
WOM Graphic

The weight of money graphic tells us on which side the money is at and how it is moving. The line indicates the WOM on our selection of the market.
In this case the WOM was persistently below 50%, that is, there was more money on the Back side, which causes the odd to drop. Sure enough, the odd dropped, but then there was a change of position and there was more money on the Lay side, which forced the odd to rise.
From this graphic you can tell that almost all of the money was on the Back side and there was almost no money on the Lay side, but then the market realized there was more value on the Lay side and inverted its position.
Examples
Example 1:
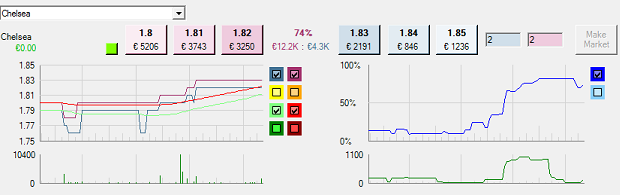
In this example you can see there was more money on the Back side, so the WOM Graphic was stable below 50%, so the odd didn't drop and the bets were matched at lower odd values.
Suddenly there was more money on the Lay side and the WOM Graphics was above 50%, forcing a market rise.
Example 2:

In this second example there was more money on the Lay side and the odd rised.
This situation went on for a while, so naturally the odd rose within moments.
Example 3:
In this third example, the WOM Graphic shows more money on the Back side, so the market dropped.
There is a lot of money coming in, but most of it is going to the Back side, so the market shows a dropping tendency line.
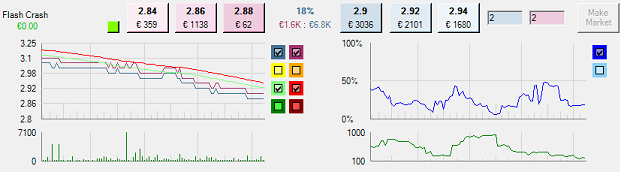
Example 4:
In this example you can see from the WOM Graphic that most of the money is on the Lay side, which forces the market to rise.
More money is constantly come in, but most of it into the Lay side, so the market presents a dropping tendency line.
Example 5:

In this fifth example, the market was stable, but then there was a change in volume, most of it on the Back side, so the market dropped.
Then the volume was maintained, but it changed directions, so most of the money was on the Lay side, forcing a market rise.
You can tell from the WOM Graphic that immediately after the market dropped there was more money coming in on the Lay side and, gradually the market changed directions.
With the help of the volume graphic, you can tell that the volume of money was maintained, it just changed directions.
These indicators are important to understand when the market is about to change directions.
Example 6:

It's also important to know when WON doesn't help. In this example the graphic changes rapidly, so it's very hard to read. Watching the graphic for a while is good to understand in which direction the market is heading. But if it's not possible to take any conclusions by analysing the graphic and the market, then it's best to stay out and wait until it all settles, to be able to read them again.
Spoofing
Since WOM became popular, several ways to manipulate it also did.
Spoofing is a process by which money is added to one side with the intention of misleading people who use this indicator as a tool to choose their market position. Spoofers do this by placing a lot of money on one side and then cancel the bets before they are matched.
Original by Peter Webb, at: BetAngel Betting Exchange Academy course.
Spoofers usually place bets at odds that will hardly be matched with the intention of missleading other traders.
Breakouts
An area that is worth exploring is the matching of a large bet in a market. Breakouts indicate that there was a period in which a large bet came in and changed the tendency of the market. Unlike spoofing, this will match bets at the current price and will keep matching at the best price available.
When you identify a large bet like this, if you are reading the market correctly, you'll know immediately which way it will move. When such a bet comes in, the market will show signs of changing and a new tendency will be created. Many people will follow that tendency, which will affect the WOM of the market. If the order is much bigger than the opposite position of the market, it will collapse immediately and the market will move away from the bet that originated the change. Even if there is an attempt to change the direction of the market, you'll have some time to manage your position before the large bet disappears.
A large amount of money coming in is easy to identify and may indicate a change in value assessment by the market, it may indicate that a large trader has come into the market or that new information has changed the market value.
To detect such changes, you should watch out for periods of little volatility, changes in WOM in relation to the current price that change that volatility. If a large order comes in at such moments that may represent a good opportunity to come into the market.
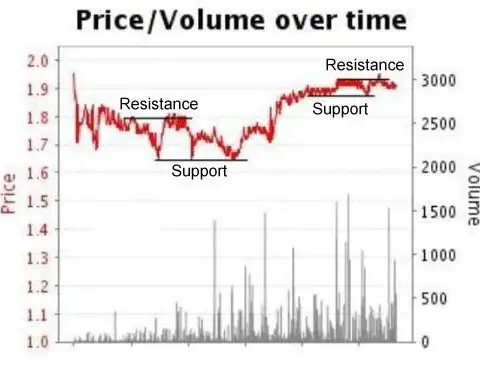
Support and resistance
These are exactly what they sound like: a tendency to support a certain odd, that is, not letting it drop below a certain value, or to resist a certain odd, that is, to resist prices above a certain odd value.
Support value is the value that presents enough volume to sustain a drop during a considerable amount of time.
The resistance value is the value that presents enough volume to resist a rise during a considerable amount of time.
When there is a period in which it's possible to identify a pattern of support and resistance values not being broken, such values represent support and resistance lines.

When a support line is broken, that line usually becomes a resistance line. Similarly, when a resistance line is broken, it then becomes a support line.